Customizing Columns in Analytics
Select the metrics you want to view in Analytics. Each screen has its own set of available metrics, and you can customize the columns for each one: channels, properties, line items, delivery sources, DSP groups, or DSP tactics. See Analytics Metrics for a breakdown of the different metrics available in Analytics.
After you customize columns, you can apply filters, save the view for future reference, and export the data as a CSV file.
To customize columns in Analytics:
-
Go to Main Menu [
 ] > Campaigns.
 -
Select the campaign, then select Analytics.
-
Find the line items, groups, tactics, properties, or delivery sources you want to view metrics for.
-
Click Settings [
 ], then select Customize columns.
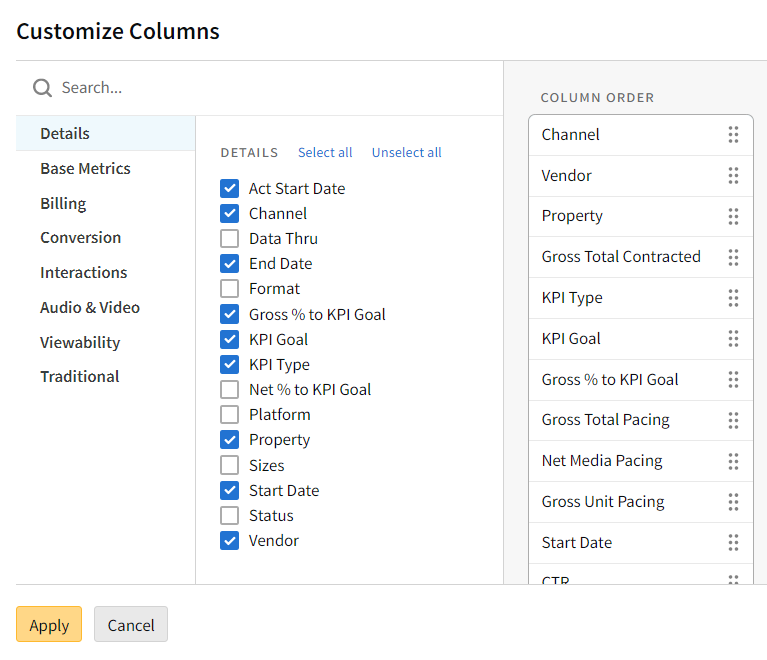
-
Select the metrics you want to view. Metrics are broken down by category on the menu on the left, and selected metrics appear on the Column Order panel on the right.
-
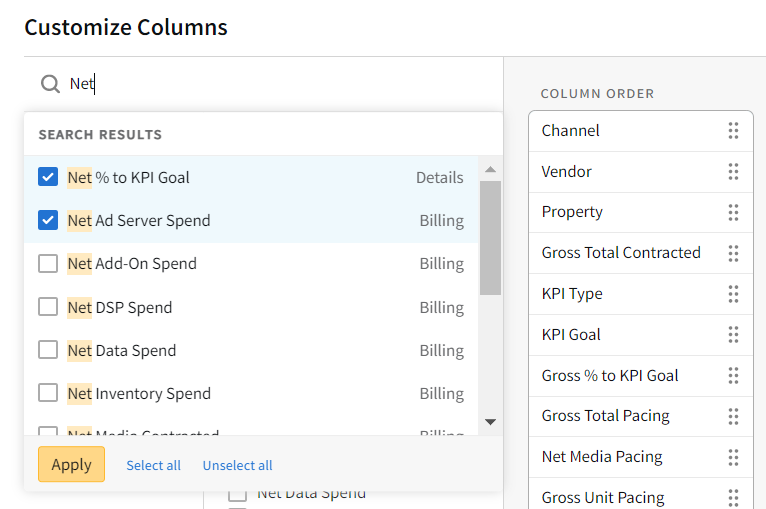
Alternatively, use the search box to find metrics. Select metrics from the search results, then click Apply.
-
-
On the Column Order panel, click-and-drag the metrics to change their order on the Analytics grid.
-
Select Apply to save your changes.