Viewing a Line Item's Performance Graph and History
To view a line item's performance graph:
-
Go to Main Menu [
 ] > Line Items.
 -
Select a campaign in the Campaign column to view a graph of how the line item is performing by Pacing and KPI.
-
Click View large graph to view a full-page graph.
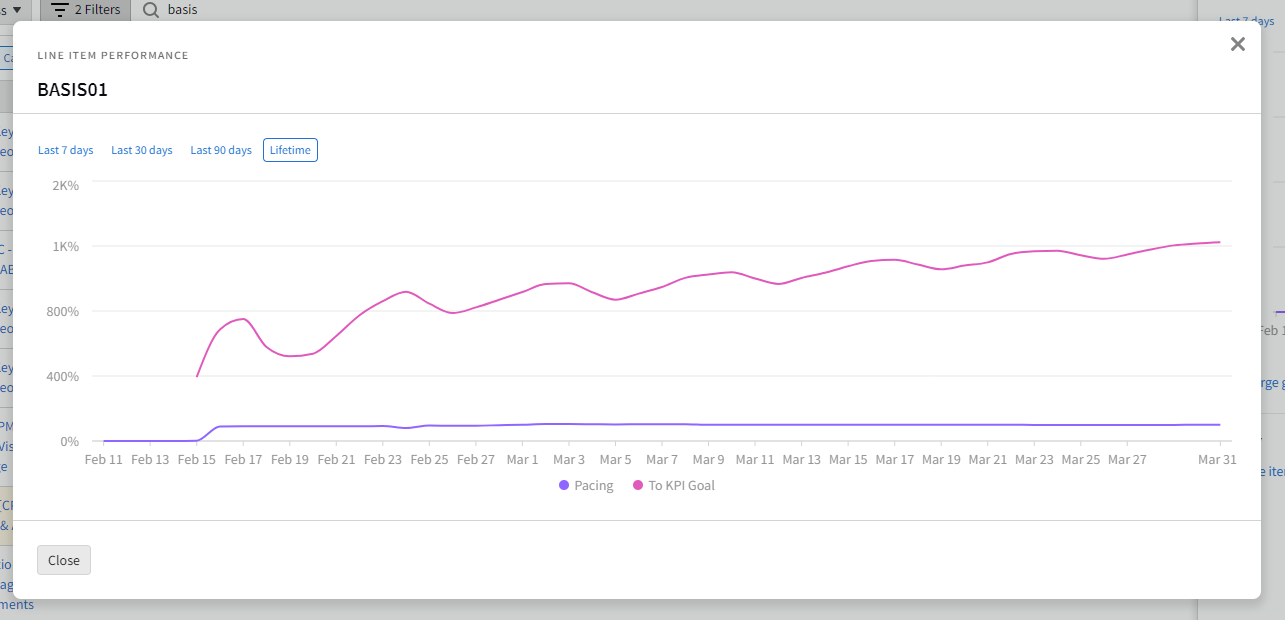
Performance Graph Details
The performance graph includes the following elements:
| Graph Element | Description |
|---|---|
| X-axis: Dates (last X days) |
Daily or intervals (by day) Select the last day interval:
The current interval selected is shown as the active filter. |
| X-axis: Pacing Percentage (%) | 100% increments |
| Performance Graph Line | Shows predictive schedule indicator (pacing and KPI %) of the designated time frame interval (Last 7 days, Last 30 days, Last 90 days, or Lifetime) (Gross or Net). |
| Graph Tooltip |
Hover on the performance graph chart to view the following information:
|
Line Item History
To view a line item's history:
A line item's history is under the performance graph. If you haven't included any history information for the selected line items, Add line item note is shown. Click this link to include history information for the selected line item in the following fields:
-
Reviewed: Enter the date the line item was reviewed.
-
Remind On: Enter a date to review the line item.
-
Reason for Review: Select a reason to review the line item:
-
Pacing
-
Performance
-
Client change
-
Other
-
-
Notes: Enter any descriptive information you'd like about the line item for you and your team.
Click Update to update a line item’s history information if applicable.
Click Download all to save a CSV file of the history of annotations for that line item.