Using Market Trends
![]()
Check out our AdTech Academy Course to learn more!
Market Trends shows advertising trends based on Basis' data and research, which help you create data-driven media plans. By automatically aggregating data from thousands of line items, Basis streamlines the process of collecting, researching, and organizing information to help you justify media strategies and create better plans with achievable objectives.
Use Market Trends to set benchmarks, compare performance, exceed your goals, and standardize sources of data and information.
- Market Trends data is an aggregated and anonymized historical data set collected across Basis. Past performance does not guarantee future results, which may vary.
- Calculations that involve spend use Net Media Spend to provide fair comparisons for benchmarks. Net Media Spend excludes margins or ad serving.
- Market Trends data updates approximately once per month. The Data Through date in the upper-left corner indicates when the data was last updated.
For additional information about Market Trends data, review our FAQ.
To use Market Trends:
-
Go to Main Menu [
 ] > Market Trends.
 -
Select the spending and performance data you want to view.
-
Filter your data sets by Date range and Vertical:
-
Date range
- Select Date range > [preset date range]. In most cases, the default is Last 3 months, though different sets of data have different options.
-
Vertical
- Select Filter > Add New > Vertical > [Option], such as Autos & Vehicles, News, or Science. You can only filter your data by one vertical at a time.
-
Verticals are defined by the user-provided labels at the campaign or line item level.
The Data Through date in the upper-left corner shows the last time Market Trends data was updated.
Market Trends Data
There are two categories of data currently available in Market Trends: Performance and Spending.
Performance
By KPI
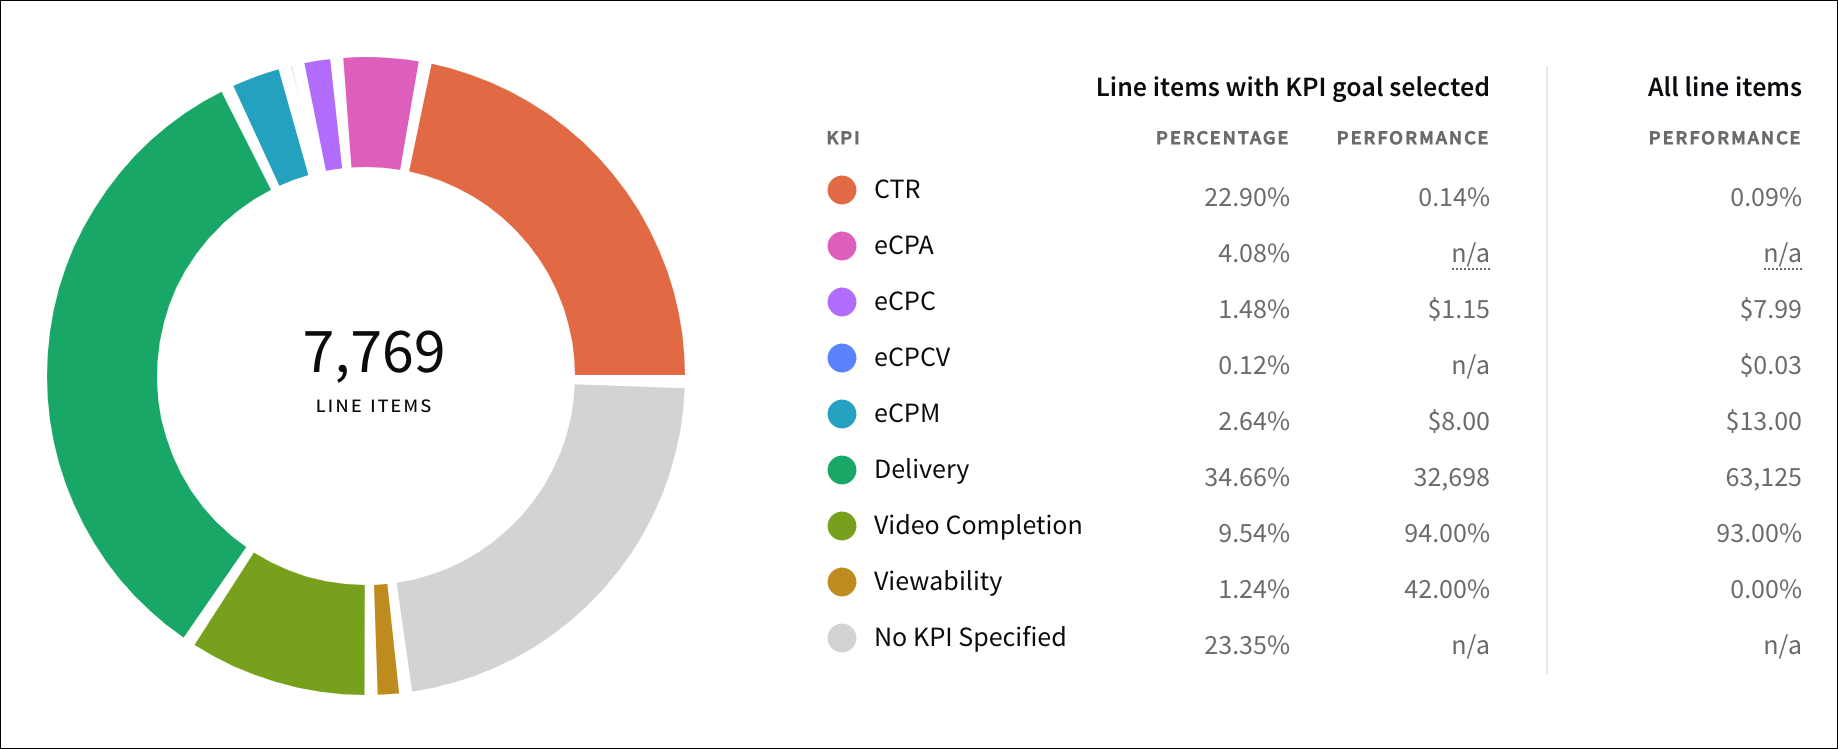
The By KPI graph shows median line item KPI performance for a given channel (Direct, DSP, Search, Social). You can filter the graph by creative type: Audio, Display, Interstitial, Text, and Video.
With this information, you can see which KPIs are most common for different verticals. For example, Autos & Vehicles line items usually have a CPA goal, while Sports line items usually have CTR.
When you create new media plans, this can help guide which goal to assign your line items and provide a target to try to exceed.
This data is broken down by line items with select KPI goals and all line items. Line items that don't have an assigned KPI fall under "Other."
Line items with KPI goal selected:
- Percent: The percent of line items that use that KPI out of all line items total.
- Performance: The median KPI performance for line items with that KPI assigned in Basis.
All line items
- Performance: The median performance achieved by all line items, regardless of the assigned KPI.
eCPA performance values are not currently available.
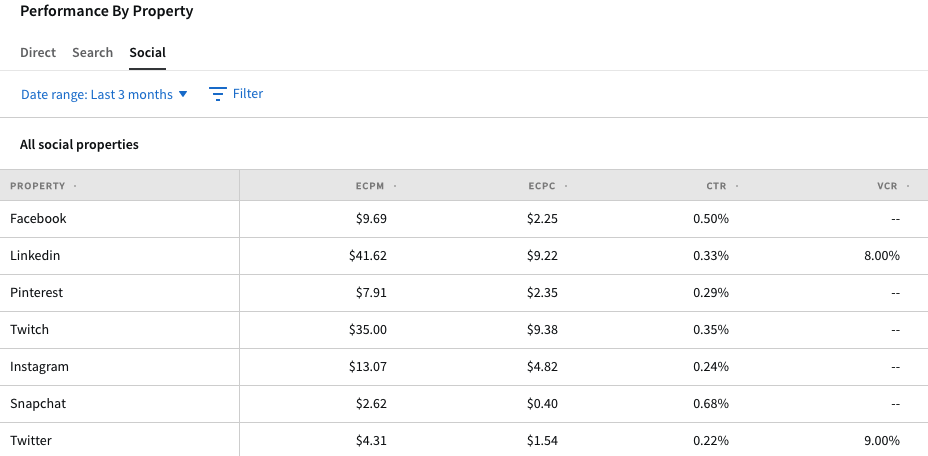
By Property
The By Property table lists the top spending properties and their performance in certain channels (Direct, Search, and Social). Performance data values are median aggregations for CPM, CPC, CTR, VCR, CPCV, Impressions, and Clicks.
Use this chart during planning to review how properties like Facebook or YouTube performed within specific time frames or by vertical. This information can guide decision making on setting budgets, bids, and which KPI values to expect.
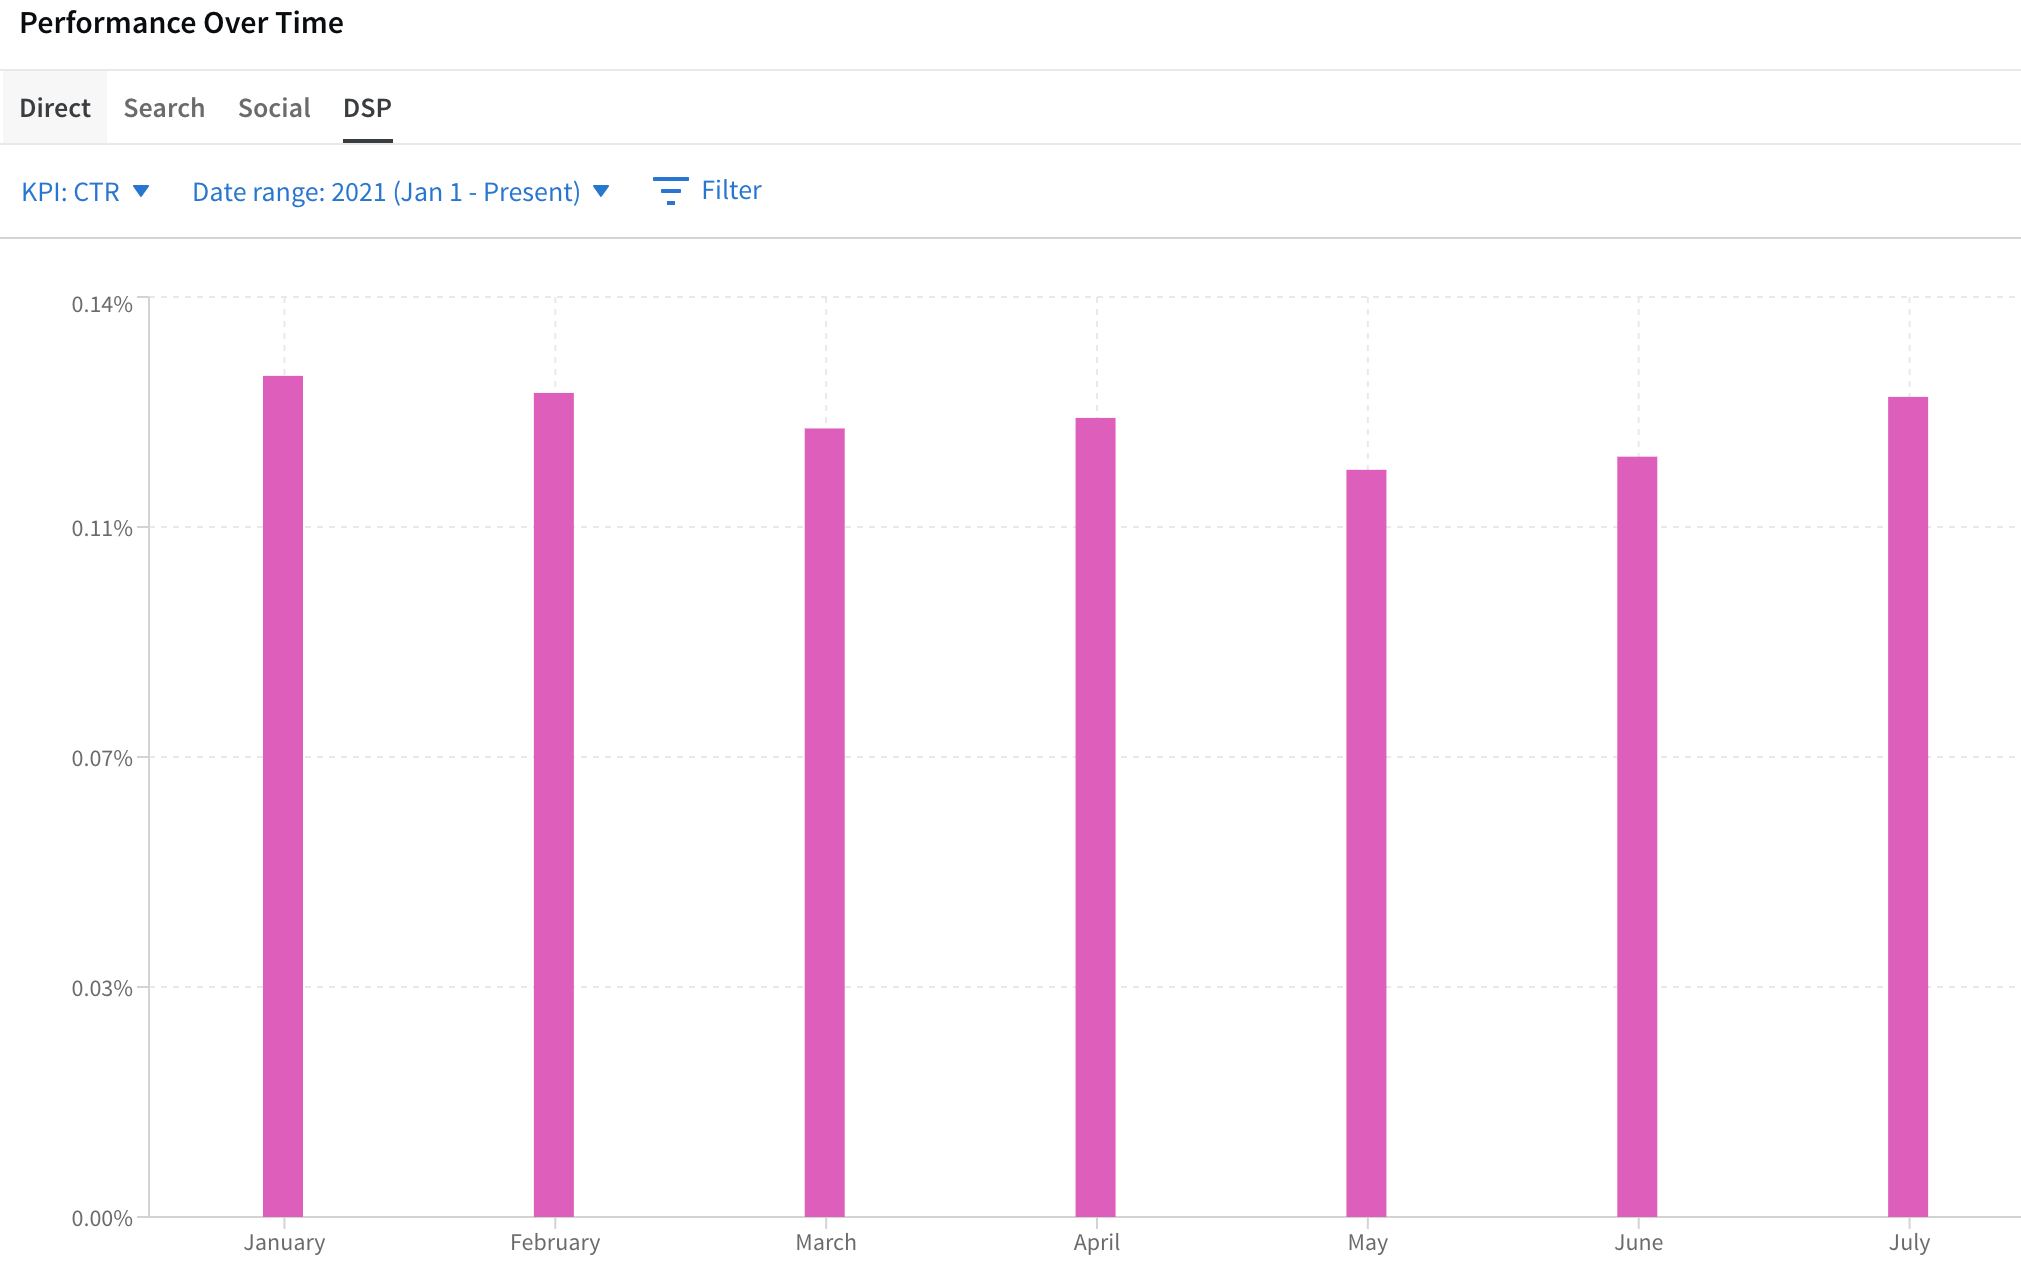
Over Time
The Over Time graph shows the trends of specific KPI values over the course of the year by month for each channel. Values are median aggregations across all line items regardless of goal type.
This gives you an idea of how a KPI's performance fluctuates month to month. For example, some KPIs may remain stable throughout the year for a certain vertical, but peak at various times for another. This highlights how seasonality might affect your campaign, and what sort of variations it may experience throughout the year.
You can filter this graph by KPI and line items:
- KPI: eCPM, CTR, eCPC, eCPCV, Delivery, Video Completion, and Viewability.
- Line Item: All or KPI Goal Selected
Spending
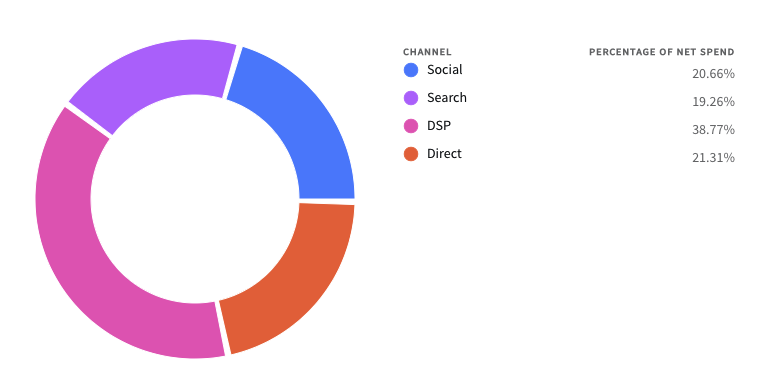
Distribution
The Distribution graph shows the percentage of net spend across different channels (Search, Social, DSP, and Direct) to help you identify how advertisers are distributing their budgets.