Campaign Performance Presentation
Overview
Campaign Performance Presentations provide detailed campaign highlights in a PowerPoint (PPTX) presentation. Use the branding-free presentation as a basis for a quarterly report or as the wrap-up report at the end of the campaign. Edit the PowerPoint to apply your own branding.
These presentations include overview slides, tables, and graphs that break down how the campaign's direct, DSP, search, and social line items performed. Currently, Basis provides line-item level data about clicks and impressions, conversions, and video views based on gross spend.
Report Options
Data Through
-
There is no maximum date range for a campaign performance presentation.
-
If you're creating a report from within a campaign, the default time frame is the campaign's start and end dates.
Customize Your Report
Select the metrics, performance stats, and graphs that you want to include in the presentation. By default, every option is selected. See the Metrics section of this article for more detailed descriptions of the KPIs that are included in the performance report.
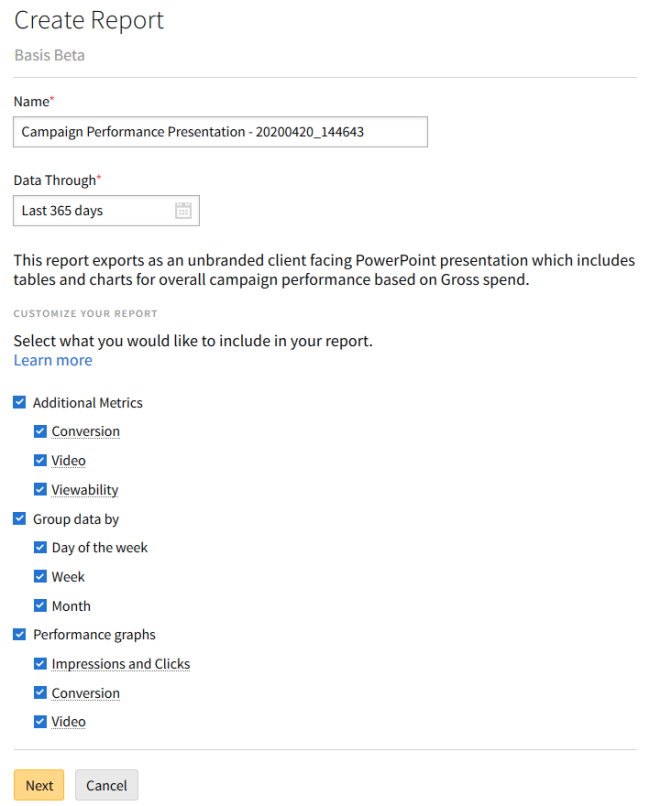
Additional Metrics
Include or exclude specific metrics from your performance tables.
-
Conversion: Total conversions, eCPA
-
Video: Video Completed, VCR, eCPCV
-
Viewability: Viewable Impressions, Measurable Impressions
Group Data By
Include or exclude additional slides, tables, and graphs that display campaign performance data aggregated by time frame.
-
Day of the week: Aggregated by day of the week (Monday, Tuesday, Wednesday, Thursday, Friday, Saturday, Sunday).
-
Weekly: Aggregated by entire week (Monday to Sunday).
-
Monthly: Aggregated by month (first of month to end of month).
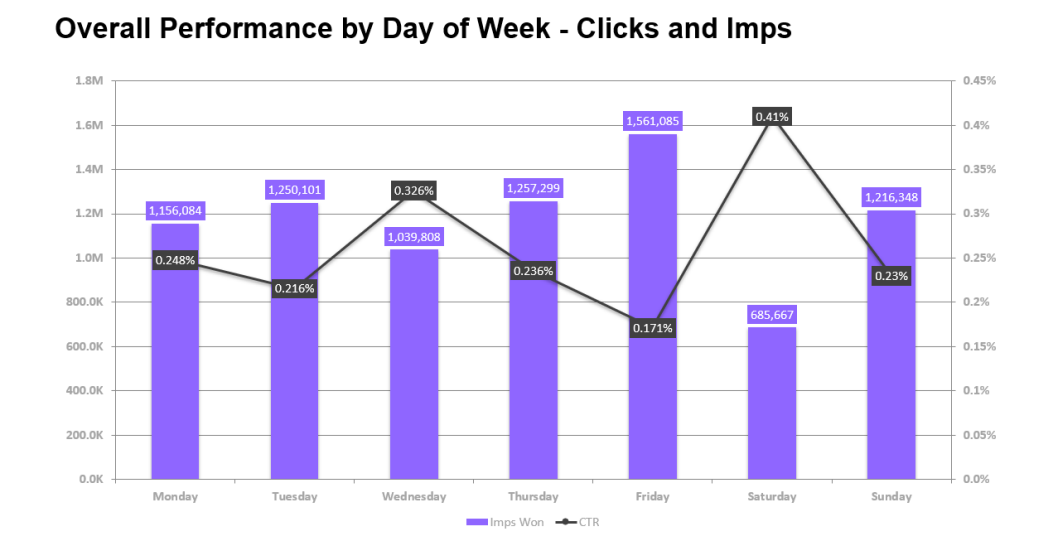
Performance Graphs
Include or exclude graphs associated with each table that visualize performance data across different campaign types and over time, if selected.
-
Impressions and Clicks: Impressions Won, CTR
-
Conversion: Conversion Rate, eCPA
-
Video: VCR, eCPCV
Metrics
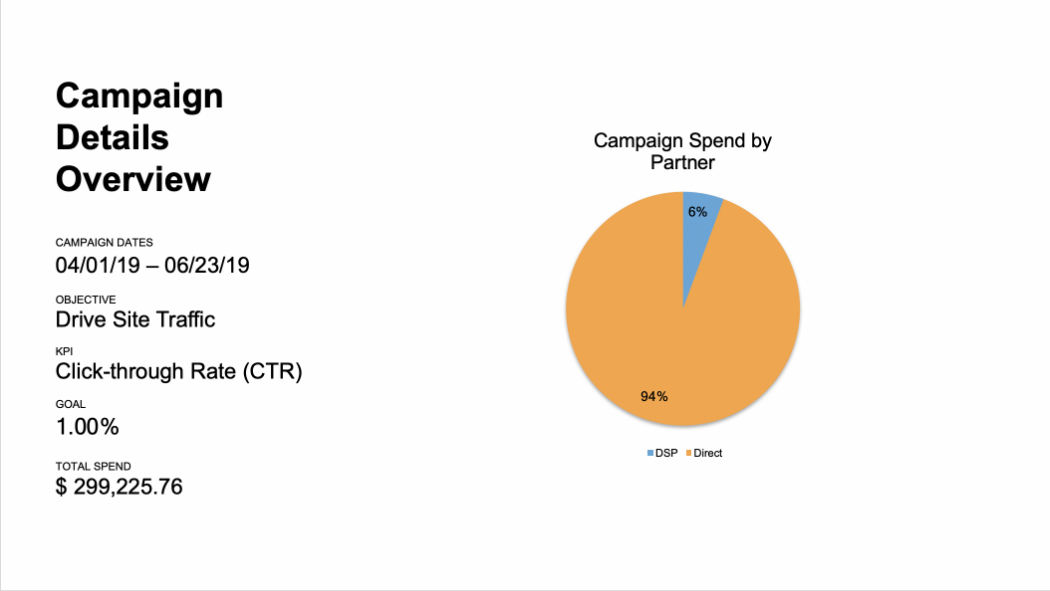
Campaign Overview Slides
| Name | Example | Description |
|---|---|---|
| Campaign Dates | 11/01/19 - 11/27/19 |
The campaign's duration as defined by its start date and end date. |
| Objective | Drive Site Traffic | The stated objective of the campaign. |
| KPI | Click-through Rate (CTR) | The key performance indicator of the campaign. |
| Goal | 1.00% | The target value of the KPI. |
| Total Spend | $100,000.83 | The amount that the campaign spent. |
| Campaign Spend by Partner | A pie graph breaking down campaign spend by type of line item, such as DSP, Direct, and Social. |
Line Item Overview Slides
| Name | Example | Description |
|---|---|---|
| Total Impressions | 5,872,192 |
The number of impressions delivered, displayed, and viewed during the campaign's lifespan. |
| Total Clicks Delivered | 78,123 | The number of clicks during of the campaign's lifespan. |
| Total Spend | $80,000 | The delivered spend. |
| Actual ECPM | $13.45 |
The delivered effective cost per mille, calculated by the formula: (Total Spend / Delivered Imps) x 1000 |
| Actual ECPC | $6.78 |
The delivered effective cost per click, calculated by the formula: Total Spend / Delivery Clicks |
| Actual CTR | 12.4% |
The delivered click-through rate, calculated by the formula: Delivered Clicks / Delivered Imps |
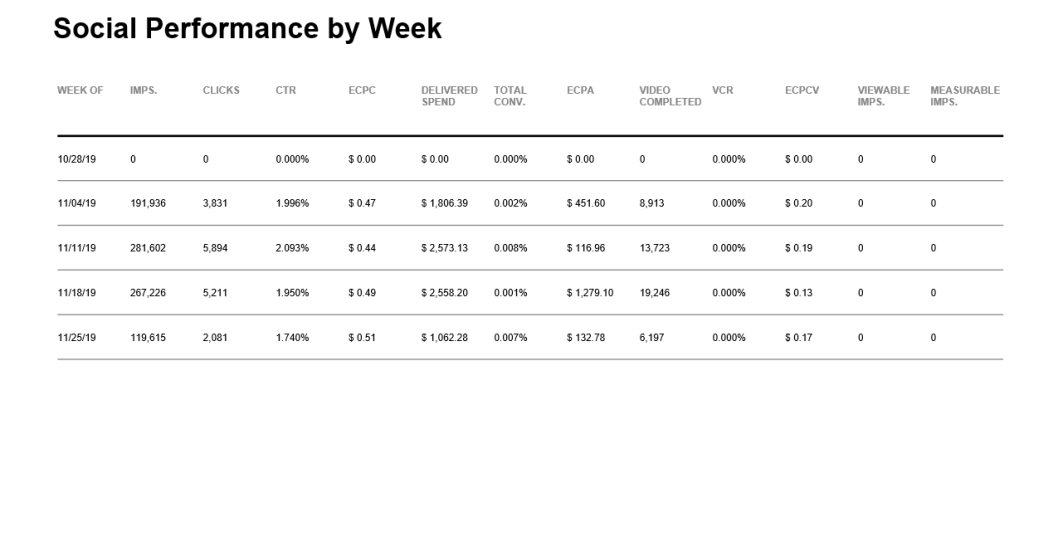
Performance Overview Slides
|
Column Name |
Example |
Description |
|---|---|---|
|
Imps |
57,838 |
The number of impressions won. |
|
Clicks |
4,175 |
The number of ad clicks delivered. |
|
CTR |
10,916.05 |
Click-through Rate = Delivered Clicks / Delivered Impressions |
| ECPC | $188.74 |
Effective Cost per Click = Total Spend / Delivery Clicks |
| Delivered Spend | $2.61 | Total spend for the campaign. |
| Total Conv. | 7.221% |
Total Conversions = Total Click Conversions + Total View Conversions |
| ECPA | $3.24 |
Effective Cost per Acquisition = Total Spend / Total Conversions |
| Video Completed | 23 |
Number of videos that were viewed to completion. |
| VCR | 80.231% |
Video Completion Rate = 100% Complete / Video Starts |
| ECPCV | $1.21 |
Effective Cost per Completed View = Total Spend / Total Videos Completed |
| Viewable Imps | 1342 | Number of delivered impressions visible to end users. |
| Measurable Imps | 1543 | Number of impressions that were measured. |
Sample Slides
Campaign Overview Slide
Overall performance data aggregated by Day of the week for Clicks and Imps
Social Campaign Performance data table aggregated by week