Data Canvas Dashboard Filters
Dashboard filters let you narrow a dashboard’s results to only the data you are interested in.
When you add, delete, or edit a dashboard filter when the dashboard is in edit mode, and save the changes, everyone who has access to the dashboard will see the updated version you saved.
When viewing a dashboard, you can temporarily update dashboard filter values, which doesn't affect any other users. This differs from filters that are part of a query underlying a dashboard tile
To change the data displayed for individual tiles, see tile filters.
External Users do not have permission to add dashboard or tile filters, so they are not able to edit the underlying query or change the view of the dashboard for other users. They can temporarily update dashboard filter values.
Dashboard filters override filters that are applied or saved to a tile's underlying query when both filters are filtering on the same exact field.
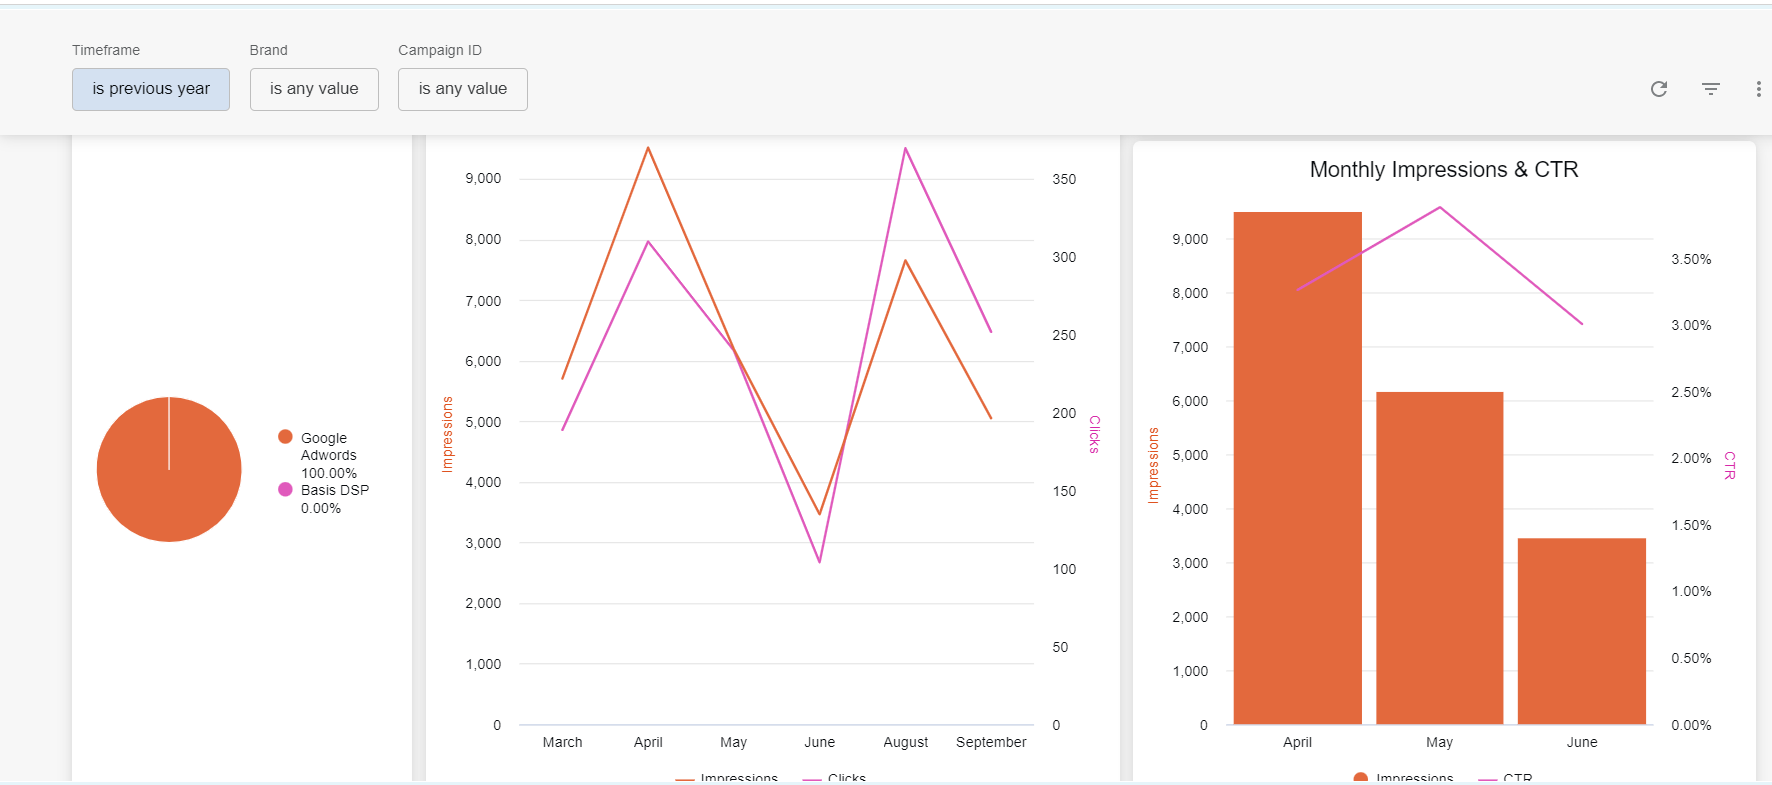
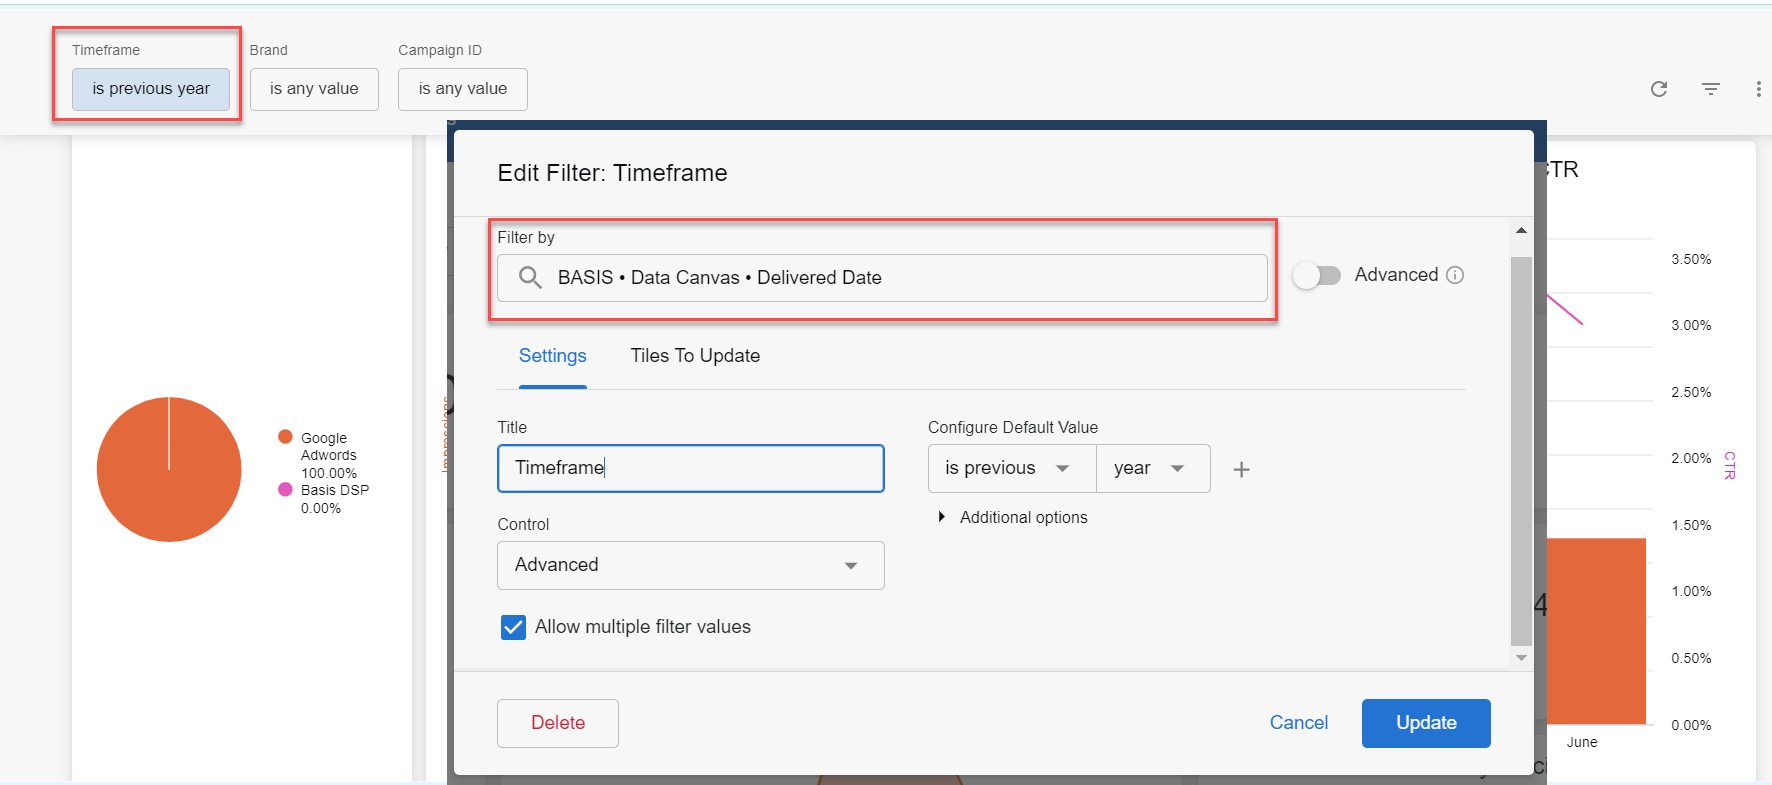
For example, if you have a dashboard filter for the field Data Canvas Delivered Date set for the previous year, every tile on the dashboard displays data for the previous year.
However, you want to see the data for Monthly Impressions & CTR tile for the last quarter, so you set the tile filter to last quarter.
Tile Filter
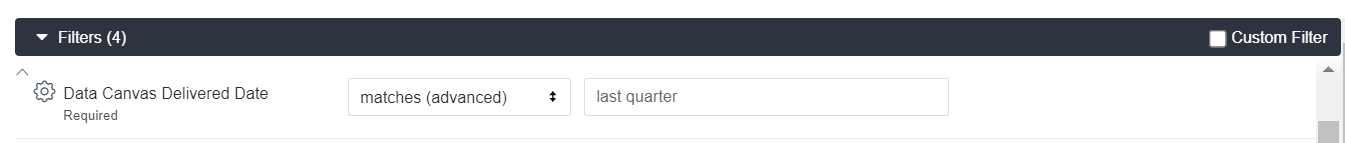
The tile still displays the data for the previous year, because the dashboard filter for the Data Canvas Delivered Date overrides the tile filter.
If you want to change the timeframe for that tile, you have to filter the tile on a different field, such as Data Canvas Delivered Month Name, and then you can include the months of the previous quarter.
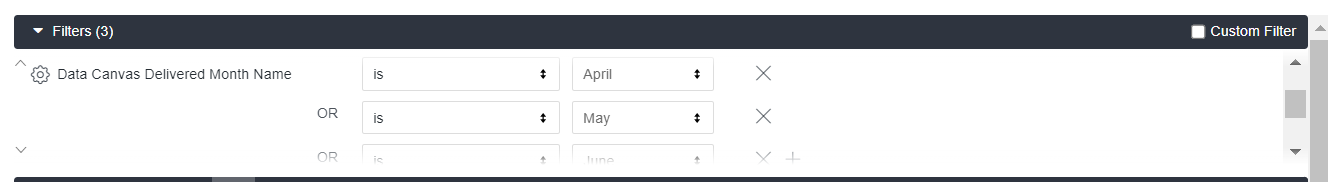
The Monthly Impressions & CTR tile is then filtered for those months, but the dashboard is still filtered for the previous year.