Filtering Data Canvas Tiles
Add filters to restrict the data you're viewing to only items of interest. For example, you might limit the results to certain dates. Any field in your Basis Data Explore can become a filter.
Dashboard filters override tile filters if the filter is for the exact same field. See Data Canvas Dashboard Filters for more information.
To add a tile filter:
-
Go to Main Menu [
 ] > Data Canvas, and select your client.
 -
Select the dashboard from the dashboard list.
-
Select Edit dashboard from the dashboard's Options [
 ].
]. -
Select Edit from the tile's Options [
]. -
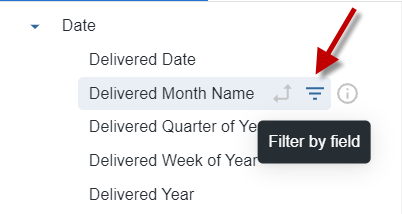
Click the filter icon next to the field in the field picker.
-
The filter appears in the Filters section.
-
To remove the filter, click the Delete [
 ] next to the filter in the Filters section.
-
-
Complete the available options for the filter. These vary depending on the filter type.
-
For example, a time dimension has options to select a time range, while a numeric dimension has options like equal to or greater than.
-
If you want to filter on a large set of values, paste a long list of values into the filter field.
-
Entering multiple values into a filter, where appropriate, creates an OR condition, meaning all the values are applied to the filter.
-
-
Optional: Click Add [
 ] to the right of a filter to add another option to the filter. The new option appears as either an OR condition or an AND condition, depending on the type of filter option.
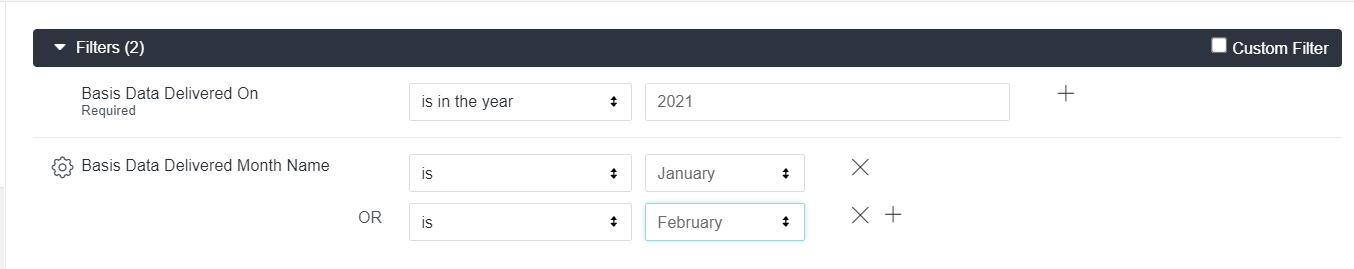
The maximum number of values you can paste may be limited by your browser or other elements along your network, and may be as small as 2,000.