Editing Data Canvas Dashboards
After you have created a dashboard from a template, use the various editing options to modify and customize your dashboard.
Although you can't edit a template to create and save your own, after you have customized a template, you can duplicate that dashboard to use for other clients and campaigns.
To edit a dashboard:
-
Go to Main Menu [
 ] > Data Canvas, and select your client.
 -
Select the dashboard from the dashboard list.
-
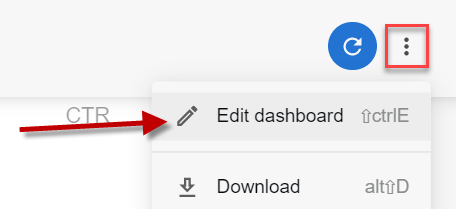
Select Edit dashboard from the dashboard's Options [
 ].
].
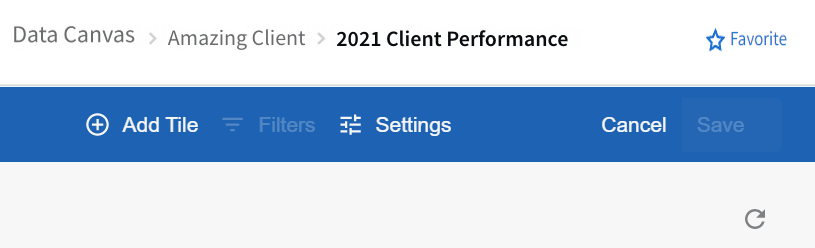
When you are in edit mode, a blue toolbar appears at the top of the dashboard, and the edit Options [![]() ] are available in the dashboard tiles.
] are available in the dashboard tiles.
In edit mode, you can add tiles, move, edit, or delete existing tiles or filters.
Dashboard Edit mode
Rearranging and Resizing Tiles
Responsive Tile Size and Grid Layout Settings
When you add a visualization to a dashboard using the grid layout, the grid arrangement is responsive to the size of the dashboard tile.
For example, if you have a dashboard tile with a visualization that uses a grid layout of four small charts, if you size the tile to be short and wide, the small charts show as one row of four. If you size the tile as a square, the small charts are repositioned to two rows of two. If you size the tile to be narrow but tall, the charts are repositioned to four rows of one.
To ensure that the grid arrangement is responsive, don't enter a number into the visualization's Number of Charts per Row setting. If you enter a value into Number of Charts per Row, the dashboard tile respects that setting regardless of the size or shape of the dashboard tile.
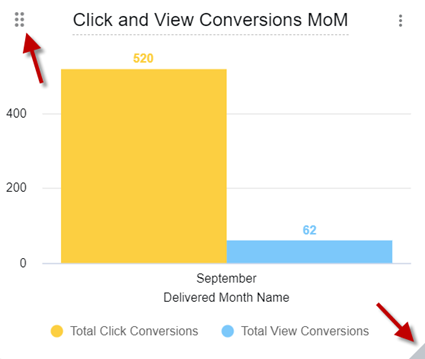
Move and Resize Tiles
You can move and resize tiles if you are in edit mode.
To move a tile, drag the six-dot icon in the upper left corner of the tile.
To resize a tile, drag on the bottom right corner of the tile.
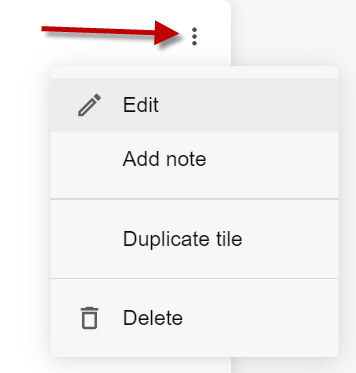
Tile Options
In edit mode, use the tile's Options [![]() ] to edit the tile, duplicate a tile, delete a tile, hide or show the tile title, and add a note to the tile.
] to edit the tile, duplicate a tile, delete a tile, hide or show the tile title, and add a note to the tile.
You can edit the tile's properties such as the title, fields, filters, visualizations, and sorting, directly in the dashboard.
Editing Tiles
Looks functionality, such as Save as Look, is not supported in Data Canvas and should not be used.
To edit the tile:
-
Go to the tile, then select Edit from the tile's Options [
]. The Edit Tile modal appears. 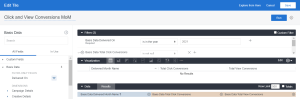
-
Make your desired changes to the tile's fields using the field picker, filters, and visualizations.
-
To edit the tile's title, click in the title while in edit mode and type. Alternatively, click in the tile's tile in the title field in the dashboard and make your edits.
-
To reorder columns in the Data section, click a column header and move the column to its desired position. Click Run to update the visualization.
-
-
Click Run to update the tile.
After the tile's changes are finished updating, the Save button is enabled. Click Save to save your changes.
If no data is showing, check the tile's timeframe filter to make sure it's for a period when data is actually available.

Deleting a Tile
To delete a tile, in edit mode, select Delete from the tile's Options [![]() ].
].
Deleting a tile cannot be undone.
Add a Tile Note
To add a note to a tile:
-
Go to the tile's edit mode.
-
Select Add note from the tile's Options [
]. -
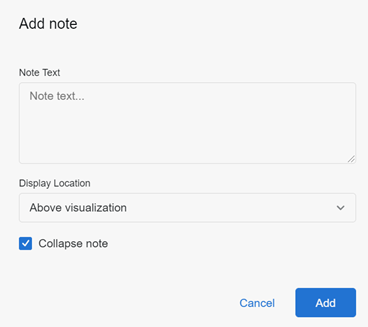
Complete the following fields in the Add note modal:
-
Note Text: Enter the note text to show on the tile. You can use plain text or HTML.
-
Display Location: Select the location where the note should be shown. Options include above the visualization, below the visualization, or as hover text that shows when users hover over a circled icon to the right of the tile's title. For tiles containing single value visualizations that are sized to be 150 pixels tall or shorter, title notes render as hover text regardless of the location selected in this field.
-
Collapse note: Select this option to collapse the note by default. A collapsed note shows only the first line, with an ellipsis at the end of the line. Clear this box to show the note’s full text by default. If you select On icon hover under Display Location, this option is not available.
-
-
Click Add. The note is added to the specified place on the tile.
After a note has been added, the tile’s Options [![]() ]selection changes to Edit note instead of Add note. Click Edit note to edit or delete your note.
]selection changes to Edit note instead of Add note. Click Edit note to edit or delete your note.
Hide Title
To hide the title of your tile, click the tile's Options [![]() ] and click Hide Title. The title is hidden.
] and click Hide Title. The title is hidden.
To show the title again, click Show Title from the tile's Options [![]() ].
].