Using the Field Picker
Use the field picker to add or remove fields from your tiles. The field picker displays the dimensions and measures applicable to the data shown in the Basis Data Explore. The fields available are the same regardless of the dashboard template chosen.
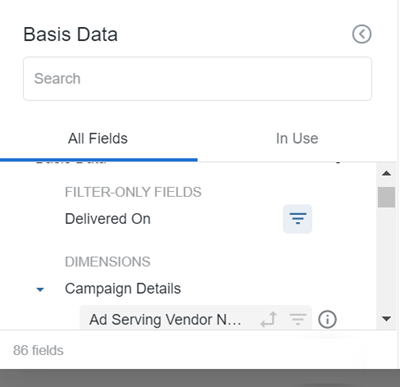
Field Picker
The following describes the elements included in the field picker:
-
Explore name: Basis Data is the name of the Explore.
-
Search bar: Type in the search bar to highlight fields containing that text.
-
All Fields tab: This tab shows all available fields in the Basis Data Explore. This tab appears by default. Fields are organized alphanumerically by type (dimensions, followed by measures) under the name of the view or view label in which they are defined. Fields that are in use are highlighted in blue.
-
In Use tab: This tab shows all the fields that are currently in use, and is organized alphanumerically by view or view label, and whether they are dimensions or measures.
-
View level summary: This shows the total number of selected fields from a view. This number is shown when the view is collapsed, and when it is expanded.
-
Field-specific information and actions: This shows a field’s current and potential functions, as well as more details about a field.
-
Explore summary: This shows the total number of fields in the Basis Data Explore in the lower-left corner.
By default, the field picker is organized by headings that correspond to the views specified by the Basis Data Explore. Each view’s fields are grouped in the field picker. The type of field (dimension, dimension group, measure, filter field) determines where the field is shown within the view.
For descriptions of the individual fields, see the Key Terms and Glossary and Calculations pages on the Basis Help Center.
The following groups of fields exist within the Basis Data Explore:
-
Dimensions:
-
Campaign Details: These fields include the specifics of the campaign, such as client/brand names, various campaign dates, KPIs, and line item details.
-
Creative Details: These fields include the specifics of the Creative, such as name, type, source, and if there is an external source.
-
Date: These fields include the various date options such as month or quarter, for each line item’s delivery.
-
Device Targeting: These fields visualize performace by Device Make, Model, OS, and Type.
-
Domain Targeting: This field visualizes performace by Domain Name.
-
Group and Tactic Details: These fields include the specifics of the Groups and Tactics, such as names, budget information, and status.
-
Location Targeting: These fields include performance data by location, such as City, Country, and Postal Code.
-
-
Measures (these measures are in GROSS only):
-
Contracted Measures: These fields include the contracted metrics, such as the various KPIs (clicks, conversions, video views) and cost data.
-
Delivery Measures: These fields include the actuals delivered, such as the various KPIs (clicks, conversions, video views) and spend data.
-
-
Filter-only fields (fields that can only be added as filters):
-
Delivered on: Filter by the date or date span that client/campaign metrics were delivered.
-
Click the arrow to the left of the group to see all the fields available within that group.
Adding Fields
To add a field from the field picker:
-
Go to Main Menu [
 ] > Data Canvas, and select your client.
 -
Select the dashboard from the dashboard list.
-
Select Edit dashboard from the dashboard's Options [
 ].
]. -
Select Edit from the tile's Options [
]. -
Click a field from the All Fields tab. The selected field is highlighted and added to the Data section of the edit tile modal.


Removing Fields
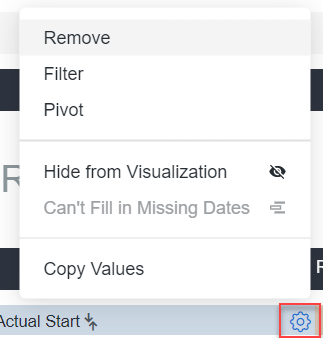
To remove a field, click a highlighted field from the In Use or All Fields tab. The field is removed from the Data section.
You can also click the gear menu of the field in the data section, and select Remove.
Field-specific Information and Actions
The icons next to each field provide more information about the field and indicate the options available for that field. The icons are visible when you hover over a field.
These icons are on the All Fields and In Use tabs, and the Pivot and Filter icons are also in the Popular Fields search bar dropdown.
You can also add these options from the fields gear menu within the data section of the edit tile window.
Click the following icons to filter or pivot by the field, to provide more field information, or to create a custom field that is based on the field:
-
Pivot
 : Click this icon to pivot or unpivot a field. This pivots one of the dimensions horizontally. Each value in the dimension becomes a column. This icon is gray when a field is not pivoted and blue when a field is pivoted.
-
Filter [
 ]: Click this icon to add a field as a filter or to remove a field as a filter. This icon is gray when a field is not being used as a filter and blue when it is an active filter.
 -
Information icon
 : Click this icon to see more details about a field. All users can see the field’s data type and description (when available).