Creating a Chart
When you select a chart, the Layout Configuration transitions the metrics from Rows to X-Axis and Columns to Series. The Level metrics in the Rows creates a multi-chart. The Properties supports the applicable labels, styles, and types based on the chart.
You also export the chart or graph to Excel. The information populates under the Chart tab on the Excel file.
To create a chart:
-
Go to Main Menu [
 ] > Insights.
 -
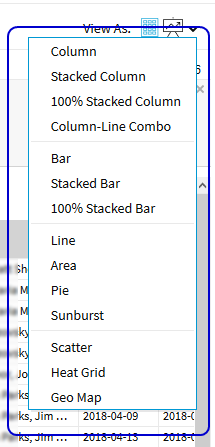
Click the Chart Format menu.
-
Select the type from the list. The available charts include Stacked Column, Bar, Pie, and Scatter.
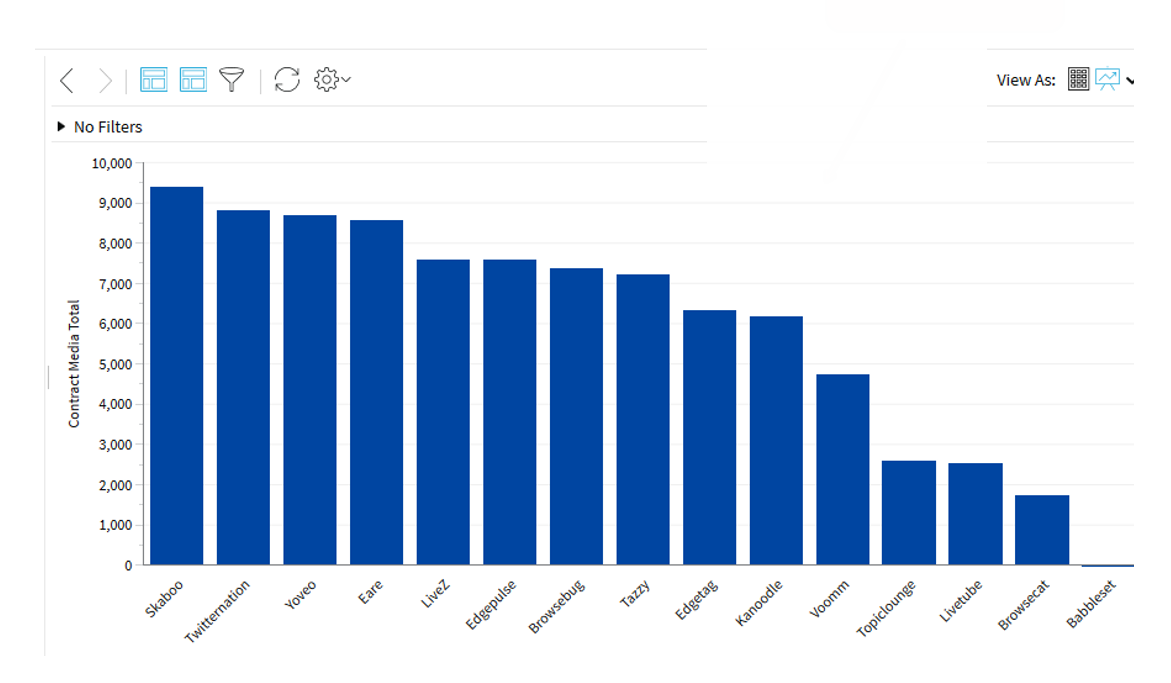
Insights - Chart Examples