Use Case Scenario: Creating a Campaign Target Spend and Pacing Chart
Goal: Create a running sum of Target Spend and Pacing Charts with custom formulas by date.
In the Layout Configuration section, add the following data fields to create the Spend report:
- Campaign ID, Line Item Name, and Date fields to the Rows section
- Pacing % (Gross Spend), Total Spend (Gross Contracted), Target Spend (Gross), and Pacing (Gross Spend) fields to the Measures section
The Pacing and Spend report shows the percentage and gross amounts.
The procedures and images assist you in creating your custom formulas and filters.
To create a Running Sum of Target Spend and Pacing Charts:
-
Go to Main Menu [
 ] > Insights.
 -
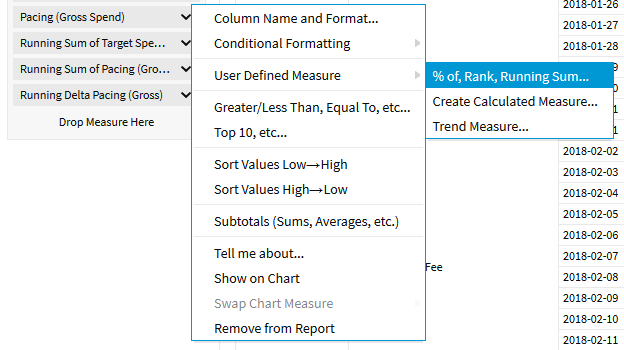
Select Target Spend (Gross) > User Defined Measure > % of, Rank, Running Sum in the Layout Configuration.

-
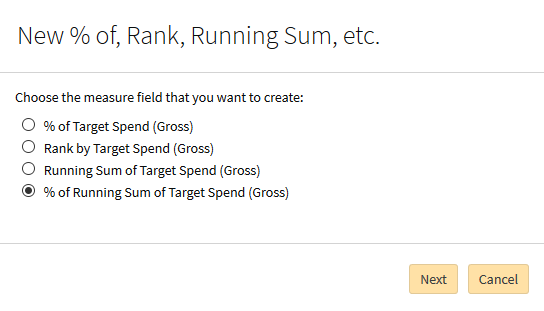
Select % of Running Sum of Target Spend (Gross).

-
Click Next.
-
Enter a Display Name, such as Running Sum of Target Spend (Gross).
-
Select a Format.
-
Select the number of Decimal Places. The Base Measure is Target Spend (Gross).
-
Select Break by > Line Item Name. The Break by option separates out to multi-reports or charts.
-
Click Done. The new Running Sum of Target Spend (Gross) appears in the table report.
Create the Running Sum of Pacing (Gross Spend) using the same procedure for Total spend (Gross Contracted) metric. The new custom formula appears in the table report.
To create the Calculated Measure Properties – Running Delta Pacing:
-
Select Pacing % (Gross Spend) > User Defined Measure > Create Calculated Measure in the Layout Configuration.

-
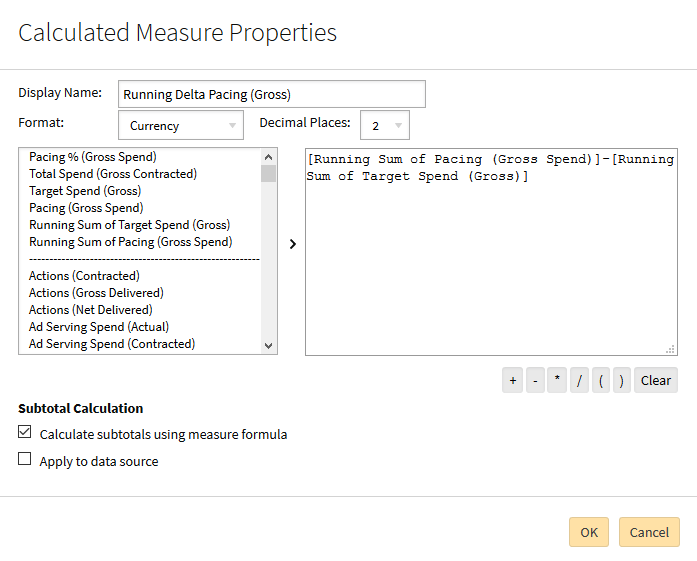
Enter a Display Name, such as Running Delta Pacing (Gross).
-
Select a Format, such as Currency.
-
Select the number of Decimal Places, such as 2.
-
Click Clear. The column to the right of the modal clears of any metric MDX (formula(s)).
-
Double-Click Pacing % (Gross Spend). The MDX appears in the column to the right of the modal.
-
Enable Calculate subtotals using measure formula.
-
Optional: Select Apply to data source to enable this function.
-
Click OK. The new Running Delta Pacing (Gross) appears in the table report.
Filter the report by Campaign ID and Rate Type (Gross).
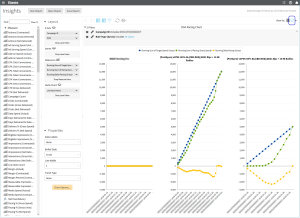
Select the chart format. The spend and pacing charts appear. The X-Axis, Series, Measures, Multi-Chart, and Properties appears in the Layout Configuration.
