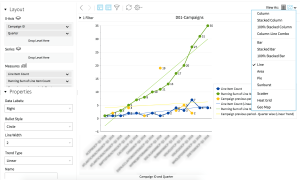
Use Case Scenario: Creating a Running Sum and Trend Measure of the Line Items by Campaign ID Report
Goal: Create a Running Sum of the Line Item and Trend Measure of the Line Item Count analysis by Campaign ID.
In the Layout Configuration section, add the following data fields to create the line item analysis report:
- Campaign ID and Quarter fields to the Rows section
- Line Item Count to the Measures section
The procedures and images assist you in creating your custom report.
To create a Running Sum of Line Item Count Procedure:
-
Go to Main Menu [
 ] > Insights.
 -
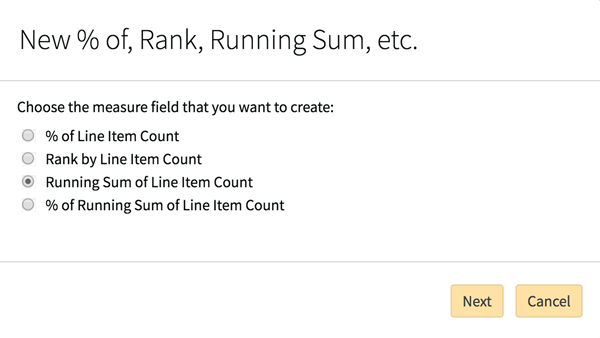
Select Line Item Count > User Defined Measure > % of, Rank, Running Sum in the Layout Configuration.
-
Select Running Sum of Line Item Count.
-
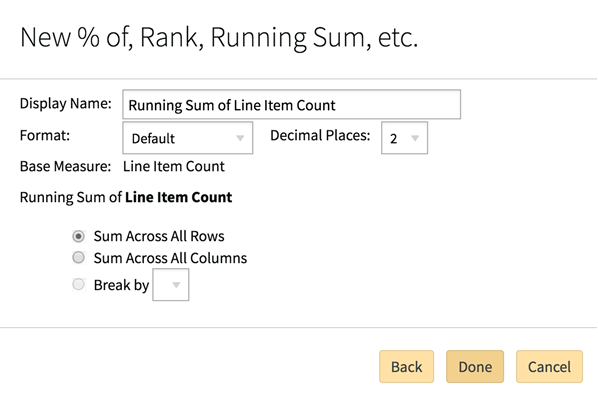
Click Next. The Base Measure automatically populates in the next modal.
-
Enter a Display Name, such as Running Sum of Line Item Count.
-
Select a Format.
-
Select the number of Decimal Places.
-
Select Sum Across All Rows for Running Sum of Line Item Count.
-
Click Done. The new fields appear in the report.
A Trend Measure report requires a time field, such as Quarter.
To create a Trend Analysis for the Line Item Count:
-
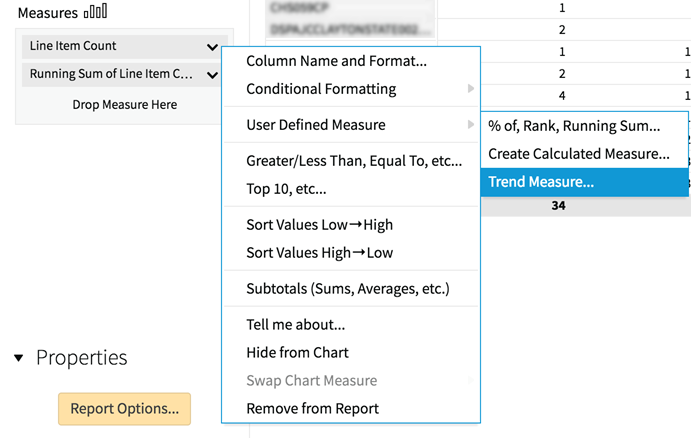
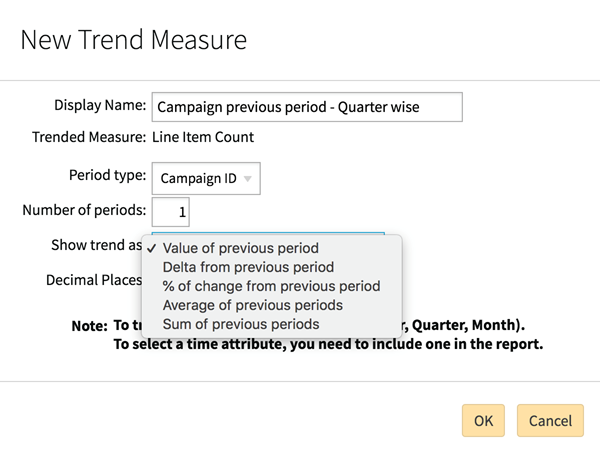
Select Line Item Count > User Defined Measure > Trend Measure in the Layout Configuration. The Trended Measure automatically populates with Line Item Count.
-
Select a Period type.
-
Enter the Number of periods.
-
Select Value of previous period for Show trend as.
-
Select the number of Decimal Places.
-
Click OK. The new fields appear in the report.
-
Filter the report by Campaign ID. Select the chart format.
