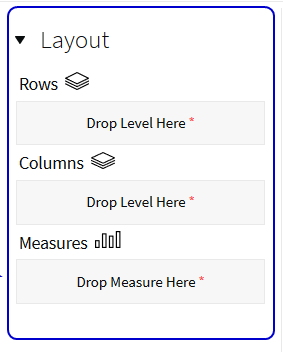
Layout Configuration Panel
You build the Insights report by selecting and customizing the metric field names. The available data fields appear by Measure, Level, and Time in alphabetical order by default. You double-click or drop and drag the data field into the Layout Configuration panel. The Level metrics appears in rows and columns. The Measure metrics fields appear in the measures zone.
The resulting Insights report appears in the Table Layout section.
Rows and Columns - Layout Section Drop Menu Options
- Edit - Modify field details
- Also Show - Display additional related metrics
- Show Properties
- Filter... - Configure filter options
- Top 10, etc... - Configure numeric filter
- Sort A->Z- Display in ascending alphabetical order
- Sort Z->A - Display in descending alphabetical order
- Show Subtotals - Calculates and displays field totals
- Tell me about... - Provides field details
- Remove from Report - Deletes the field from the table report
Measures - Layout Section Drop Menu Options
- Column Name and Format... - Edit column names
- Conditional Formatting - Select Color Scale, Data Bar, and Trend Arrow
- User Defined Measure -Create custom formulas
- Greater/Less Than, Equal To, etc... - Configure numeric filter
- Top 10, etc... - Configure numeric filter
- Sort Values Low->High- Display in ascending numeric order
- Sort Values High->Low- Display in descending numeric order
- Subtotals (Sums, Averages, etc.) - Calculates and displays field totals
- Tell me about... - Provides field details
- Hide form Chart - Conceals the field from the chart
- Swap Chart Measure - Select an existing chart option from the drop menu
- Remove Report - Deletes the field from the table report