Analytics
![]()
Check out our AdTech Academy Course to learn more!
In Analytics, you can view metrics and performance data for live and approved campaigns, as well as optimize DSP line items to improve performance. You can also track delivery, make adjustments to your groups and tactics based on live data, export this information as a CSV file, and access the campaign's reports.
For information about available metrics Analytics, see Analytics Metrics. For additional metrics and calculations, see Key Terms and Concepts and Calculations.
To customize the Analytics tab page, see Customize and Save Views.
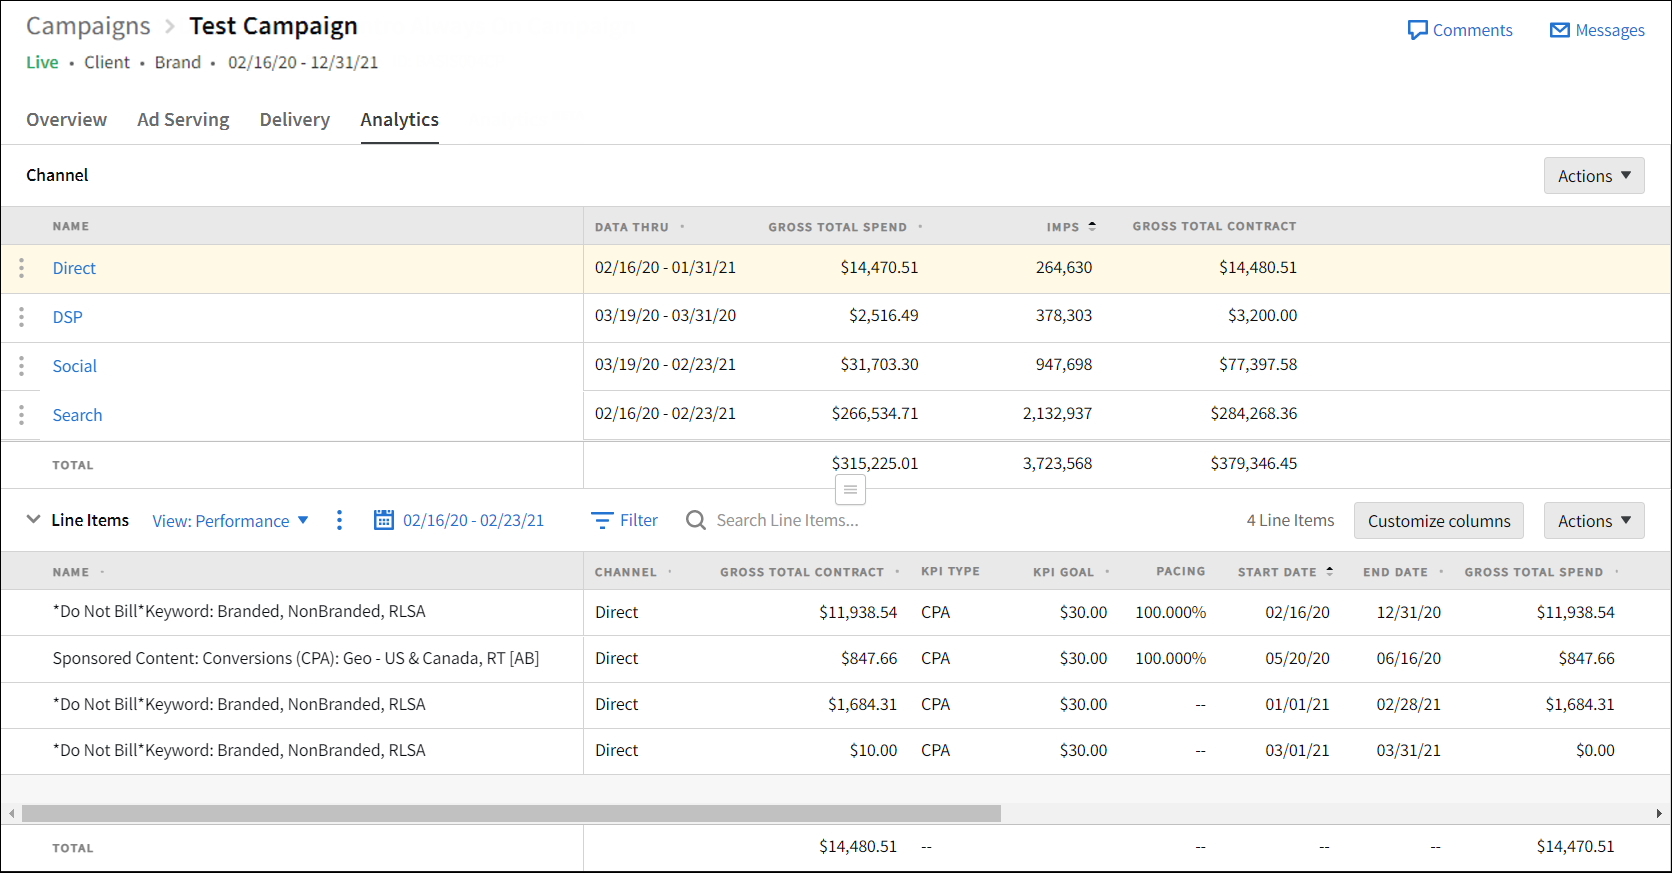
After your campaign is approved or goes live, view performance metrics and data on the Analytics tab.
Split Screen Overview
Campaign analytics are shown in a split-screen view. Each half of the screen shows performance data such as impressions, spend, pacing, win rate, and revenue. Totals are calculated and shown along the bottom of each half.
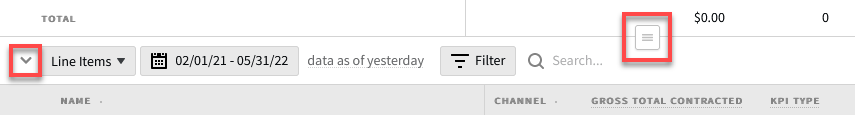
Adjust the size of each screen by dragging the toggle in the middle up or down. Click the downward facing arrow (V) on the left to collapse the bottom screen.
By default, the top screen shows the campaign's channels, such as Direct, Search, Social, and DSP, and the bottom screen shows the line items for the selected channel. If a campaign only contains one channel, then the Analytics tab will automatically show the line items on the top screen by default.
Navigation
-
Select a channel to view its line items or properties on the bottom screen.
-
Use the menu in the upper-left corner of the bottom screen to switch between the channel's line items or properties.
-
The Properties view provides a high-level overview of delivery and spend by property. Click a property's name to view analytics for all lines items using that property.
-
-
If your campaign includes add-ons, Add-ons appears beneath the channels. Select this row to view add-ons metrics on the bottom screen.
-
Click a channel's name to go down one level in the hierarchy and view its line items on the top screen, and the line item's delivery sources on the bottom screen.
-
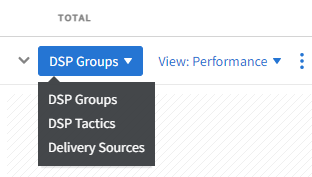
For DSP, you can view delivery sources, DSP groups, or DSP tactics on the bottom screen using the menu in the upper-left corner.
-
-
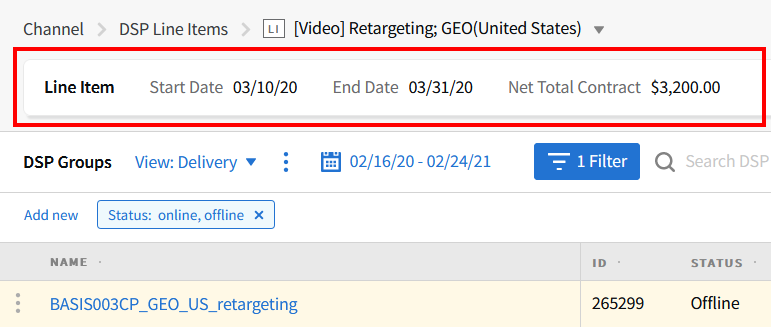
Select a DSP line item to view its groups on the top screen, and that group's tactics on the bottom screen. You'll see general line item metrics at the top.
-
Click Hide line item to remove this information and create more space for your groups and tactics.
-
-
Click a DSP group's name to see all of its tactics in a full-screen view.
-
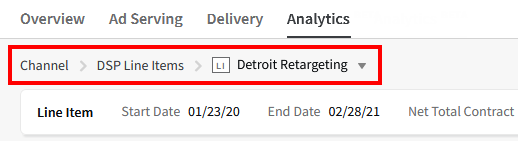
Use the breadcrumbs at the top to switch between different DSP groups and tactics or to return to previous levels.
Analytics Settings
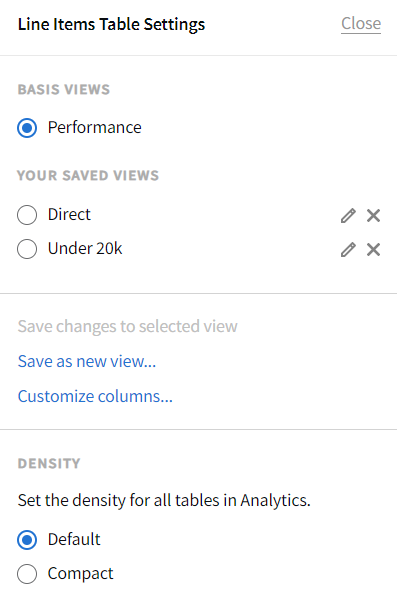
Adjust each screen's settings to select the metrics you want to view, save custom views, and change the density for the tables to maximize screen space.
To change the setting for Analytics:
-
Click Settings (gear icon) in the upper-right corner to customize columns, create and apply saved views, and switch to a compact layout.
-
To further customize your tables, apply filters to each screen. See the following articles for more information:
- Customizing Columns in Analytics
- Applying Filters in Analytics
- Saving Views in Analytics
Editing DSP Groups and Tactics
Based on the campaign's performance, you can directly edit groups and tactics from Analytics without having to return to the media plan overview. See Editing Groups and Tactics in Analytics for more information.
Line Item Comments
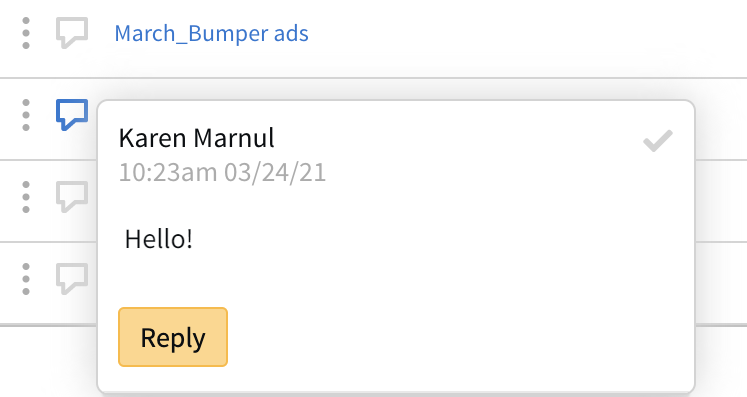
Click the comments button next to a line item to view, post, or resolve comments. See Line Item Comments for more information.
Sending Vendor Performance Alerts
You can send vendor performance alerts for non-DSP line items.